Since its introduction in April, the revolutionary Payroll Efficiency Index has been changing the way multinational organizations of all sizes look at their payroll operations. The first-of-its kind report leverages anonymized payroll processing data from the 2,500 global entities on the CloudPay platform to examine process efficiency and set benchmarks for payroll performance at the global, regional, and country levels.
Rather than relying on the limited, traditional method of measuring payroll performance through SLAs and output reports, the PEI measures five key efficiency metrics that focus on the process itself. In addition to helping payroll professionals better understand how individual processing factors impact overall efficiency, this new model enables teams to identify bottlenecks, breakdowns, and opportunities for improvement that would otherwise be missed.
Here, we take a closer look at the second efficiency metric presented in the report — the percentage of issues caused at the data input phase of payroll — and how it impacts global payroll processing.
What It Is
The data input issues metric measures the percentage of errors caused by the entry of incorrect or incomplete employee payroll data into the payroll system. Data input issues is calculated by dividing the total number of issues with a root cause in customer data by the total number of issues that occur.
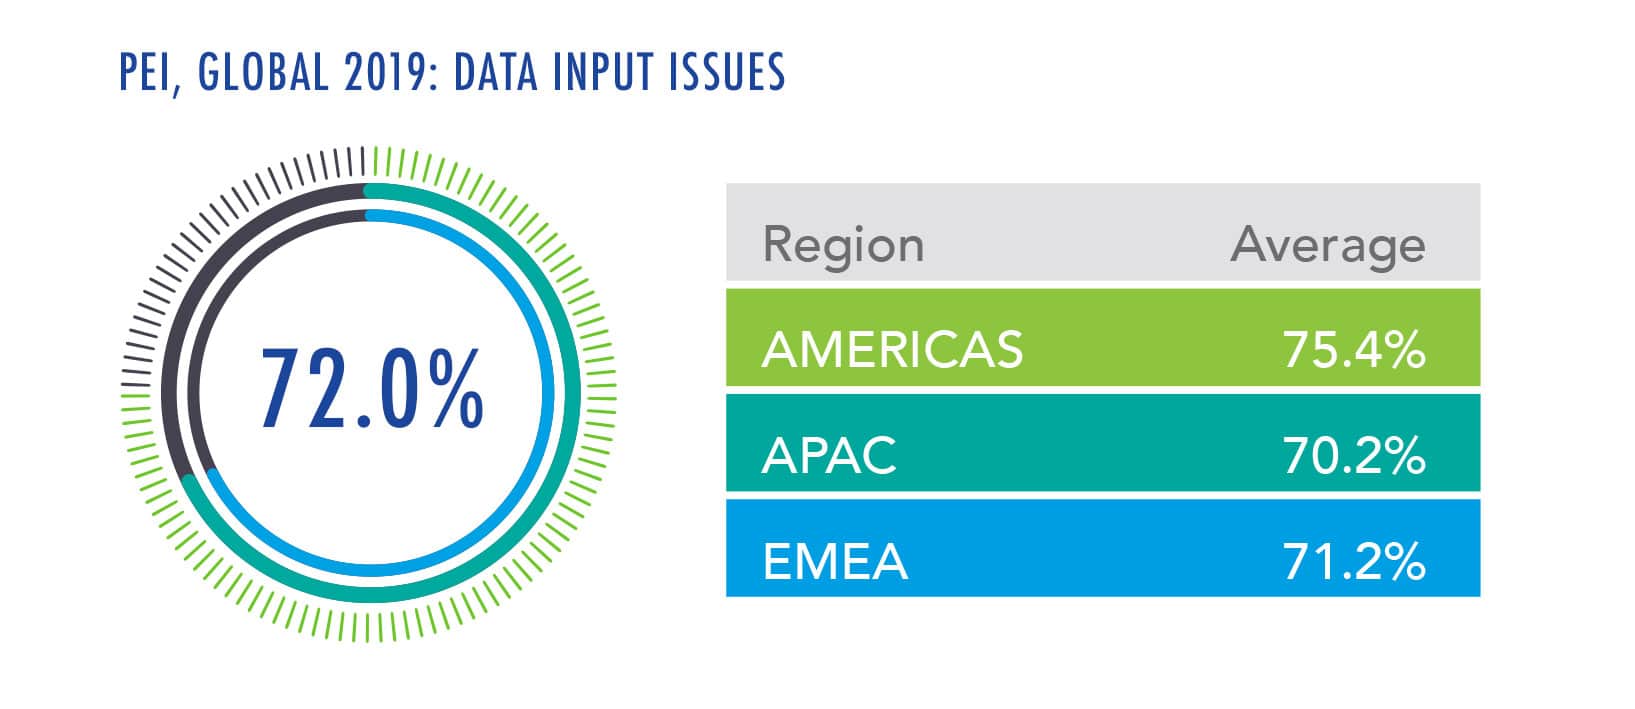
From January through December of 2018, the global average rate of data input issues was 72.0%. The highest average came from the Americas, with a rate of 75.4%, trailed by EMEA with 71.2% and APAC with just 70.2%.

Why It’s Important
Data input issues is a prime example of how deeper analysis can make a dramatic difference in the value of intelligence gained. While standard payroll output reports include a total error count per month or per payroll cycle, they won’t necessarily tell you where or when in the process those issues occurred.
Conversely, gaining the insight that 72%, for example, of process issues stem from errors in data input tells you exactly where to focus your improvement efforts. A high rate of data input issues can signal poor collection methods or faulty transfer of that data. Perhaps your payroll process relies heavily on manual data transfers that allow errors to be introduced or replicated. Or you could find that certain required data fields are incomplete when the data is transferred into the system.
When looking at a specific step in the payroll process, it’s equally important to examine upstream activities that could impact the quality of information that arrives at that step. Teams must recognize that the data coming into payroll often comes from multiple areas of the business, beyond just HR, such as the commissions team or the mobility team. Efforts to improve that source data, as well as its collection and transfer, can lead to broader discussions and process improvements that can have larger impacts across the organization.
However, if the data is complete and correct when it comes to payroll, it’s likely time to reconsider the transfer or input method used. Data input remains one of the most manual parts of the payroll process and one of the most consistent sources of errors. This suggests that organizations of all sizes and across all regions could benefit from standardizing collection methods and integrating related systems. Often, the fix for high rates of data input issues is additional, focused training and ensuring new hires receive adequate training as part of the on-boarding process.
For Example: A technology company based in Spain and with approximately 1,000 employees in more than 20 countries was experiencing vastly inconsistent payroll error rates across countries. A closer look at the KPIs revealed a similar variance in the percentage of data input issues, causing them to examine how the payroll data was being collected and entered into the system in the underperforming countries Ultimately, the company decided to integrate their payroll and HCM systems to ensure complete, consistent data was available to the payroll team going forward.
How To Use It
All CloudPay customers have access to the metric data directly in our Analytics tool, where they can view their own data and compare it against companies similar in size and location. This benchmarking data is widely available in the Global 2019 Payroll Efficiency Index. If you’re not a CloudPay customer but can calculate or estimate your percentage of data input issues, you can compare that figure to the average in your countries and regions.
If you see a high percentage of data input issues, work with your payroll team and global payroll provider to identify possible factors and how they affect data accuracy.
For 2018, the PEI shows that the rate of data input issues increased in proportion to headcount. Payrolls with 1-50 employees had around 66% of issues occur at data input, while those with 51-200 averaged over 71%, and headcounts of more than 200 averaged above 78%.
However, the average figures disguise the variance that exists in rates of data input issues from country to country. The highest percentage of data input errors is 96.1% in China, which leads Panama and Taiwan as the only countries with percentages above 90%. On the low end, a number of countries average less than 50% data input issues. Only one comes in under 30%, however: Norway has the lowest count of data input issues globally, at just 26.7%.
For additional information and country rankings, download the complete PEI report at payrollefficiencyindex.com.


